Page 39 - Šolsko polje, XXVII, 2016, no. 3-4: IEA ICILS in druge sodobne teme, ur. Eva Klemenčič
P. 39
mirazchiyski ■ the digital divide ...
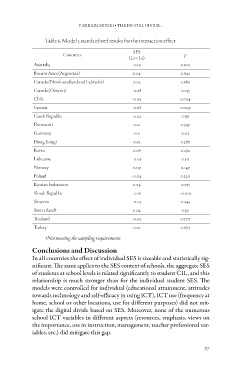
Table 6. Model 3 standardized results for the interaction effect
Countries SES p
(L1 × L2)
Australia 0.001
Buenos Aires (Argentina) -0.10 0.641
Canada (Newfoundland and Labrador) 0.04 0.680
Canada (Ontario) 0.02 0.055
Chile -0.08 0.004
Croatia -0.09 0.009
Czech Republic -0.08 0.391
Denmark† -0.02 0.747
Germany 0.01 0.112
Hong Kong† -0.11 0.287
Korea 0.05 0.292
Lithuania 0.06 0.315
Norway -0.05 0.147
Poland 0.09 0.220
Russian Federation -0.04 0.275
Slovak Republic 0.04 <0.001
Slovenia -0.16 0.245
Switzerland† -0.05 0.531
Thailand 0.04 0.777
Turkey -0.02 0.674
0.01
†Not meeting the sampling requirements
Conclusions and Discussion
In all countries the effect of individual SES is sizeable and statistically sig
nificant. The same applies to the SES context of schools, the aggregate SES
of students at school levels is related significantly to student CIL, and this
relationship is much stronger than for the individual student SES. The
models were controlled for individual (educational attainment, attitudes
towards technology and self-efficacy in using ICT), ICT use (frequency at
home, school or other locations, use for different purposes) did not mit
igate the digital divide based on SES. Moreover, none of the numerous
school ICT variables in different aspects (resources, emphasis, views on
the importance, use in instruction, management, teacher professional var
iables, etc.) did mitigate this gap.
37