Page 35 - Šolsko polje, XXVII, 2016, no. 3-4: IEA ICILS in druge sodobne teme, ur. Eva Klemenčič
P. 35
p. mirazchiyski ■ the digital divide ...
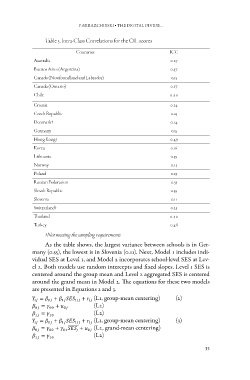
Table 3. Intra-Class Correlations for the CIL scores
Countries ICC
Australia 0.27
Buenos Aires (Argentina) 0.37
Canada (Newfoundland and Labrador) 0.15
Canada (Ontario) 0.17
Chile 0.40
Croatia 0.14
Czech Republic 0.25
Denmark† 0.14
Germany 0.55
Hong Kong† 0.49
Korea 0.16
Lithuania 0.39
Norway 0.13
Poland 0.19
Russian Federation 0.35
Slovak Republic 0.39
Slovenia 0.11
Switzerland† 0.23
Thailand 0.40
Turkey 0.48
†Not meeting the sampling requirements
As the table shows, the largest variance between schools is in Ger
many (0.55), the lowest is in Slovenia (0.11). Next, Model 1 includes indi
vidual SES at Level 1, and Model 2 incorporates school-level SES at Lev
el 2. Both models use random intercepts and fixed slopes. Level 1 SES is
centered around the group mean and Level 2 aggregated SES is centered
around the grand mean in Model 2. The equations for these two models
are presented in Equations 2 and 3.
(L1, group-mean centering) (2)
(L2) (3)
(L2)
(L1, group-mean centering)
(L2, grand-mean centering)
(L2)
33