Page 38 - Šolsko polje, XXVII, 2016, no. 3-4: IEA ICILS in druge sodobne teme, ur. Eva Klemenčič
P. 38
šolsko polje, letnik xxvii, številka 3–4
Countries SES (L1) p (compositi- p
onal effect,
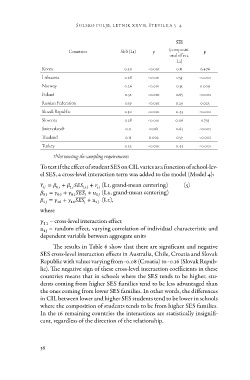
Korea 0.20 <0.001 0.476
Lithuania 0.28 <0.001 L2) <0.001
Norway 0.26 <0.001 0.11 0.009
Poland 0.32 <0.001 0.53 <0.001
Russian Federation 0.19 <0.001 0.33 0.023
Slovak Republic 0.30 <0.001 0.65 <0.001
Slovenia 0.28 <0.001 0.29 0.735
Switzerland† 0.11 0.061 0.43 <0.001
Thailand 0.13 0.002 0.06 <0.001
Turkey 0.22 <0.001 0.63 <0.001
0.59
0.43
†Not meeting the sampling requirements
To test if the effect of student SES on CIL varies as a function of school-lev
el SES, a cross-level interaction term was added to the model (Model 4):
(L1, grand-mean centering) (5)
(L2, grand-mean centering)
(L2),
where
– cross-level interaction effect
– random effect, varying correlation of individual characteristic and
dependent variable between aggregate units
The results in Table 6 show that there are significant and negative
SES cross-level interaction effects in Australia, Chile, Croatia and Slovak
Republic with values varying from -0.08 (Croatia) to -0.16 (Slovak Repub
lic). The negative sign of these cross-level interaction coefficients in these
countries means that in schools where the SES tends to be higher, stu
dents coming from higher SES families tend to be less advantaged than
the ones coming from lower SES families. In other words, the differences
in CIL between lower and higher SES students tend to be lower in schools
where the composition of students tends to be from higher SES families.
In the 16 remaining countries the interactions are statistically insignifi
cant, regardless of the direction of the relationship.
36
Countries SES (L1) p (compositi- p
onal effect,
Korea 0.20 <0.001 0.476
Lithuania 0.28 <0.001 L2) <0.001
Norway 0.26 <0.001 0.11 0.009
Poland 0.32 <0.001 0.53 <0.001
Russian Federation 0.19 <0.001 0.33 0.023
Slovak Republic 0.30 <0.001 0.65 <0.001
Slovenia 0.28 <0.001 0.29 0.735
Switzerland† 0.11 0.061 0.43 <0.001
Thailand 0.13 0.002 0.06 <0.001
Turkey 0.22 <0.001 0.63 <0.001
0.59
0.43
†Not meeting the sampling requirements
To test if the effect of student SES on CIL varies as a function of school-lev
el SES, a cross-level interaction term was added to the model (Model 4):
(L1, grand-mean centering) (5)
(L2, grand-mean centering)
(L2),
where
– cross-level interaction effect
– random effect, varying correlation of individual characteristic and
dependent variable between aggregate units
The results in Table 6 show that there are significant and negative
SES cross-level interaction effects in Australia, Chile, Croatia and Slovak
Republic with values varying from -0.08 (Croatia) to -0.16 (Slovak Repub
lic). The negative sign of these cross-level interaction coefficients in these
countries means that in schools where the SES tends to be higher, stu
dents coming from higher SES families tend to be less advantaged than
the ones coming from lower SES families. In other words, the differences
in CIL between lower and higher SES students tend to be lower in schools
where the composition of students tends to be from higher SES families.
In the 16 remaining countries the interactions are statistically insignifi
cant, regardless of the direction of the relationship.
36