Page 36 - Šolsko polje, XXVII, 2016, no. 3-4: IEA ICILS in druge sodobne teme, ur. Eva Klemenčič
P. 36
šolsko polje, letnik xxvii, številka 3–4
where
– regression slope
– average regression slope across all clusters (fixed effect)
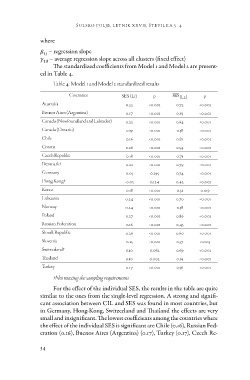
The standardized coefficients from Model 1 and Model 2 are present
ed in Table 4.
Table 4. Model 1 and Model 2 standardized results
Countries SES (L1) p (L2) p
Australia 0.22 <0.001 0.72 <0.001
Buenos Aires (Argentina) 0.17 <0.001 0.63 <0.001
Canada (Newfoundland and Labrador) 0.22 <0.001 0.64 <0.001
Canada (Ontario) 0.19 <0.001 0.58 <0.001
Chile 0.16 <0.001 0.82 <0.001
Croatia 0.26 <0.001 0.54 <0.001
Czech Republic 0.18 <0.001 0.71 <0.001
Denmark† 0.22 <0.001 0.79 <0.001
Germany 0.05 0.295 0.74 <0.001
Hong Kong† -0.05 0.124 0.42 <0.001
Korea 0.18 <0.001 0.31 0.019
Lithuania 0.24 <0.001 0.70 <0.001
Norway 0.24 <0.001 0.58 <0.001
Poland 0.27 <0.001 0.86 <0.001
Russian Federation 0.16 <0.001 0.43 <0.001
Slovak Republic 0.26 <0.001 0.60 <0.001
Slovenia 0.25 <0.001 0.37 0.003
Switzerland† 0.10 0.062 0.69 <0.001
Thailand 0.10 0.002 0.65 <0.001
Turkey 0.17 <0.001 0.56 <0.001
†Not meeting the sampling requirements
For the effect of the individual SES, the results in the table are quite
similar to the ones from the single-level regression. A strong and signifi
cant association between CIL and SES was found in most countries, but
in Germany, Hong-Kong, Switzerland and Thailand the effects are very
small and insignificant. The lowest coefficients among the countries where
the effect of the individual SES is significant are Chile (0.16), Russian Fed
eration (0.16), Buenos Aires (Argentina) (0.17), Turkey (0.17), Czech Re
34
where
– regression slope
– average regression slope across all clusters (fixed effect)
The standardized coefficients from Model 1 and Model 2 are present
ed in Table 4.
Table 4. Model 1 and Model 2 standardized results
Countries SES (L1) p (L2) p
Australia 0.22 <0.001 0.72 <0.001
Buenos Aires (Argentina) 0.17 <0.001 0.63 <0.001
Canada (Newfoundland and Labrador) 0.22 <0.001 0.64 <0.001
Canada (Ontario) 0.19 <0.001 0.58 <0.001
Chile 0.16 <0.001 0.82 <0.001
Croatia 0.26 <0.001 0.54 <0.001
Czech Republic 0.18 <0.001 0.71 <0.001
Denmark† 0.22 <0.001 0.79 <0.001
Germany 0.05 0.295 0.74 <0.001
Hong Kong† -0.05 0.124 0.42 <0.001
Korea 0.18 <0.001 0.31 0.019
Lithuania 0.24 <0.001 0.70 <0.001
Norway 0.24 <0.001 0.58 <0.001
Poland 0.27 <0.001 0.86 <0.001
Russian Federation 0.16 <0.001 0.43 <0.001
Slovak Republic 0.26 <0.001 0.60 <0.001
Slovenia 0.25 <0.001 0.37 0.003
Switzerland† 0.10 0.062 0.69 <0.001
Thailand 0.10 0.002 0.65 <0.001
Turkey 0.17 <0.001 0.56 <0.001
†Not meeting the sampling requirements
For the effect of the individual SES, the results in the table are quite
similar to the ones from the single-level regression. A strong and signifi
cant association between CIL and SES was found in most countries, but
in Germany, Hong-Kong, Switzerland and Thailand the effects are very
small and insignificant. The lowest coefficients among the countries where
the effect of the individual SES is significant are Chile (0.16), Russian Fed
eration (0.16), Buenos Aires (Argentina) (0.17), Turkey (0.17), Czech Re
34