Page 33 - Šolsko polje, XXVII, 2016, no. 3-4: IEA ICILS in druge sodobne teme, ur. Eva Klemenčič
P. 33
p. mirazchiyski ■ the digital divide ...
Analytical Methods
In the first step, the differences in CIL across individual and school SES
are tested using bivariate linear regression models. School SES is aggregat
ed individual SES at the school level as a measure of the contextual effect.
Prior to analysis the index was linearly transformed to have a mean of 50
and a standard deviation of 10 points to be in line with the rest of the scale
variables used in the study. In the second step, variables on different indi
vidual student, home and school characteristics are added to the regres
sion models to account for their influence on the relationship between
CIL and SES.
Results
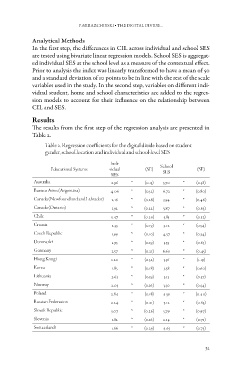
The results from the first step of the regression analysis are presented in
Table 2.
Table 2. Regression coefficients for the digital divide based on student
gender, school location and individual and school-level SES
Educational Systems Indi- (SE) School (SE)
vidual SES
SES
Australia 2.96 * (0.15) 5.70 * (0.38)
Buenos Aires (Argentina) 4.06 * (0.52) 6.72 * (0.80)
Canada (Newfoundland and Labrador) 2.16 * (0.28) 3.94 * (0.46)
Canada (Ontario) 1.92 * (0.22) 3.87 * (0.63)
Chile 3.47 * (0.20) 5.85 * (0.32)
Croatia 2.33 * (0.19) 3.12 * (0.54)
Czech Republic 1.99 * (0.10) 4.37 * (0.34)
Denmark† 1.93 * (0.19) 3.59 * (0.65)
Germany 2.57 * (0.21) 6.60 * (0.45)
Hong Kong† 1.20 * (0.32) 5.56 * (1.19)
Korea 1.85 * (0.18) 3.38 * (0.60)
Lithuania 2.63 * (0.19) 5.13 * (0.57)
Norway 2.03 * (0.16) 3.50 * (0.54)
Poland 2.84 * (0.18) 4.59 * (0.40)
Russian Federation 2.24 * (0.21) 5.12 * (0.63)
Slovak Republic 3.07 * (0.26) 5.79 * (0.97)
Slovenia 1.82 * (0.16) 2.14 * (0.71)
Switzerland† 1.66 * (0.29) 4.65 * (0.73)
31
Analytical Methods
In the first step, the differences in CIL across individual and school SES
are tested using bivariate linear regression models. School SES is aggregat
ed individual SES at the school level as a measure of the contextual effect.
Prior to analysis the index was linearly transformed to have a mean of 50
and a standard deviation of 10 points to be in line with the rest of the scale
variables used in the study. In the second step, variables on different indi
vidual student, home and school characteristics are added to the regres
sion models to account for their influence on the relationship between
CIL and SES.
Results
The results from the first step of the regression analysis are presented in
Table 2.
Table 2. Regression coefficients for the digital divide based on student
gender, school location and individual and school-level SES
Educational Systems Indi- (SE) School (SE)
vidual SES
SES
Australia 2.96 * (0.15) 5.70 * (0.38)
Buenos Aires (Argentina) 4.06 * (0.52) 6.72 * (0.80)
Canada (Newfoundland and Labrador) 2.16 * (0.28) 3.94 * (0.46)
Canada (Ontario) 1.92 * (0.22) 3.87 * (0.63)
Chile 3.47 * (0.20) 5.85 * (0.32)
Croatia 2.33 * (0.19) 3.12 * (0.54)
Czech Republic 1.99 * (0.10) 4.37 * (0.34)
Denmark† 1.93 * (0.19) 3.59 * (0.65)
Germany 2.57 * (0.21) 6.60 * (0.45)
Hong Kong† 1.20 * (0.32) 5.56 * (1.19)
Korea 1.85 * (0.18) 3.38 * (0.60)
Lithuania 2.63 * (0.19) 5.13 * (0.57)
Norway 2.03 * (0.16) 3.50 * (0.54)
Poland 2.84 * (0.18) 4.59 * (0.40)
Russian Federation 2.24 * (0.21) 5.12 * (0.63)
Slovak Republic 3.07 * (0.26) 5.79 * (0.97)
Slovenia 1.82 * (0.16) 2.14 * (0.71)
Switzerland† 1.66 * (0.29) 4.65 * (0.73)
31