Page 76 - Šolsko polje, XXX, 2019, št. 5-6: Civic, citizenship and rhetorical education in a rapidly changing world, eds. Janja Žmavc and Plamen Mirazchiyski
P. 76
šolsko polje, letnik xxx, številka 5–6
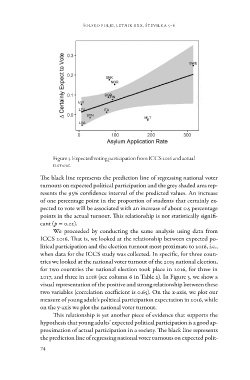
Figure 3. Expected voting participation from ICCS 2016 and actual
turnout.
The black line represents the prediction line of regressing national voter
turnouts on expected political participation and the grey shaded area rep-
resents the 95% confidence interval of the predicted values. An increase
of one percentage point in the proportion of students that certainly ex-
pected to vote will be associated with an increase of about 0.5 percentage
points in the actual turnout. This relationship is not statistically signifi-
cant (p = 0.22).
We proceeded by conducting the same analysis using data from
ICCS 2016. That is, we looked at the relationship between expected po-
litical participation and the election turnout most proximate to 2016, i.e.,
when data for the ICCS study was collected. In specific, for three coun-
tries we looked at the national voter turnout of the 2015 national election,
for two countries the national election took place in 2016, for three in
2017, and three in 2018 (see column 6 in Table 2). In Figure 3, we show a
visual representation of the positive and strong relationship between these
two variables (correlation coefficient is 0.65). On the x-axis, we plot our
measure of young adult’s political participation expectation in 2016, while
on the y-axis we plot the national voter turnout.
This relationship is yet another piece of evidence that supports the
hypothesis that young adults’ expected political participation is a good ap-
proximation of actual participation in a society. The black line represents
the prediction line of regressing national voter turnouts on expected polit-
74