Page 75 - Šolsko polje, XXX, 2019, št. 5-6: Civic, citizenship and rhetorical education in a rapidly changing world, eds. Janja Žmavc and Plamen Mirazchiyski
P. 75
rožman, d. cortés ■ expected political participation and demogr aphic changes ...
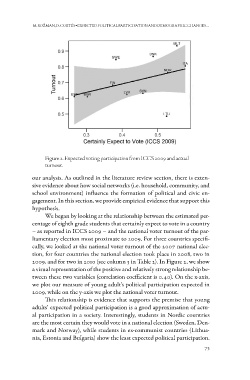
Figure 2. Expected voting participation from ICCS 2009 and actual
turnout.
our analysis. As outlined in the literature review section, there is exten-
sive evidence about how social networks (i.e. household, community, and
school environment) influence the formation of political and civic en-
gagement. In this section, we provide empirical evidence that support this
hypothesis.
We began by looking at the relationship between the estimated per-
centage of eighth grade students that certainly expect to vote in a country
– as reported in ICCS 2009 – and the national voter turnout of the par-
liamentary election most proximate to 2009. For three countries specifi-
cally, we looked at the national voter turnout of the 2007 national elec-
tion, for four countries the national election took place in 2008, two in
2009, and for two in 2010 (see column 3 in Table 2). In Figure 2, we show
a visual representation of the positive and relatively strong relationship be-
tween these two variables (correlation coefficient is 0.40). On the x-axis,
we plot our measure of young adult’s political participation expected in
2009, while on the y-axis we plot the national voter turnout.
This relationship is evidence that supports the premise that young
adults’ expected political participation is a good approximation of actu-
al participation in a society. Interestingly, students in Nordic countries
are the most certain they would vote in a national election (Sweden, Den-
mark and Norway), while students in ex-communist countries (Lithua-
nia, Estonia and Bulgaria) show the least expected political participation.
73