Page 92 - Šolsko polje, XXX, 2019, št. 5-6: Civic, citizenship and rhetorical education in a rapidly changing world, eds. Janja Žmavc and Plamen Mirazchiyski
P. 92
šolsko polje, letnik xxx, številka 5–6
something belonging to you on purpose”). Overall, eighth-graders in Slo-
venia are more likely to report peer violence than the international aver-
age. Educational systems with high percentages of reported peer violence
are Croatia, the Dominican Republic, Colombia, Lithuania, Malta, Mex-
ico, Peru and Slovenia. The least violence is detected in Chinese Taipei,
Finland, Italy, Netherlands, the Russian Federation and Sweden (Kle-
menčič, Mirazchiyski and Novak, 2018, p. 92).
Table 3 reports the results of experiencing different forms of bully-
ing, for eighth graders from Slovenia. About 28% of students’ reported
that they experienced once that another student said things about him/
her to make others laugh, about 18% were exposed to the same form of
bullying two to four times in the last three months prior to data collec-
tion. Almost 17% of eighth-graders experienced five or more times in
the last three months (a survey was conducted before summer 2016) be-
ing called an offensive nickname by another student. Threats with phys-
ical violence, or even physical assault, were less frequent, however, more
than 10% of students experienced threats or physical assault at least once
in the last three months. About 19% of students reported that another
student intentionally harmed them at least once in the last three months.
A lower rate of reported cyberbullying was also detected. The majority of
eighth-graders in Slovenia were not exposed to bullying in the last three
months prior to data collection.
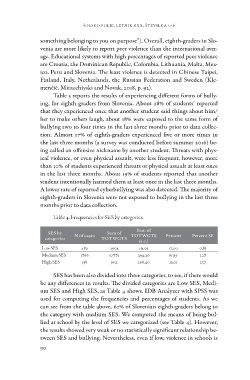
Table 4. Frequencies for SES by categories.
SES by N of cases Sum of Sum of Percent Percent SE
categories TOTWGTS TOTWGTS
480 17,00 0,83
Low SES 1766 (s.e.) 61,99 1,27
Medium SES 598 21,01 1,37
High SES 2954 151,05
10771 294,26
3652 268,40
SES has been also divided into three categories, to see, if there would
be any differences in results. The divided categories are Low SES, Medi-
um SES and High SES, as Table 4 shows. IDB Analyzer with SPSS was
used for computing the frequencies and percentages of students. As we
can see from the table above, 62% of Slovenian eighth-graders belong to
the category with medium SES. We computed the means of being bul-
lied at school by the level of SES we categorized (see Table 4). However,
the results showed very weak or no statistically significant relationship be-
tween SES and bullying. Nevertheless, even if low, violence in schools is
90
something belonging to you on purpose”). Overall, eighth-graders in Slo-
venia are more likely to report peer violence than the international aver-
age. Educational systems with high percentages of reported peer violence
are Croatia, the Dominican Republic, Colombia, Lithuania, Malta, Mex-
ico, Peru and Slovenia. The least violence is detected in Chinese Taipei,
Finland, Italy, Netherlands, the Russian Federation and Sweden (Kle-
menčič, Mirazchiyski and Novak, 2018, p. 92).
Table 3 reports the results of experiencing different forms of bully-
ing, for eighth graders from Slovenia. About 28% of students’ reported
that they experienced once that another student said things about him/
her to make others laugh, about 18% were exposed to the same form of
bullying two to four times in the last three months prior to data collec-
tion. Almost 17% of eighth-graders experienced five or more times in
the last three months (a survey was conducted before summer 2016) be-
ing called an offensive nickname by another student. Threats with phys-
ical violence, or even physical assault, were less frequent, however, more
than 10% of students experienced threats or physical assault at least once
in the last three months. About 19% of students reported that another
student intentionally harmed them at least once in the last three months.
A lower rate of reported cyberbullying was also detected. The majority of
eighth-graders in Slovenia were not exposed to bullying in the last three
months prior to data collection.
Table 4. Frequencies for SES by categories.
SES by N of cases Sum of Sum of Percent Percent SE
categories TOTWGTS TOTWGTS
480 17,00 0,83
Low SES 1766 (s.e.) 61,99 1,27
Medium SES 598 21,01 1,37
High SES 2954 151,05
10771 294,26
3652 268,40
SES has been also divided into three categories, to see, if there would
be any differences in results. The divided categories are Low SES, Medi-
um SES and High SES, as Table 4 shows. IDB Analyzer with SPSS was
used for computing the frequencies and percentages of students. As we
can see from the table above, 62% of Slovenian eighth-graders belong to
the category with medium SES. We computed the means of being bul-
lied at school by the level of SES we categorized (see Table 4). However,
the results showed very weak or no statistically significant relationship be-
tween SES and bullying. Nevertheless, even if low, violence in schools is
90