Page 87 - Šolsko polje, XXX, 2019, št. 5-6: Civic, citizenship and rhetorical education in a rapidly changing world, eds. Janja Žmavc and Plamen Mirazchiyski
P. 87
javornik et al. ■ bullying of eighth graders in slovenian primary schools
2. Continuous variables with a ratio or scale level of measurement.
These variables were obtained from the responses of sets of questions
using IRT (see the previous section for more details).
The analysis of the relationship between the students being bullied
and the categorical variables was done by computing the average of the
bullying scale for each category a respondent (student, student teachers
and school principals) chose. The differences between the means across
categories (each mean with each mean) were then tested for statistical sig-
nificance using multiple dummy coded regression. The report includes re-
sults only for those categorical variables in the data which showed signifi-
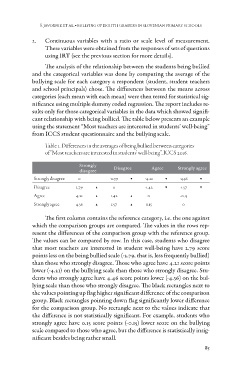
cant relationship with being bullied. The table below presents an example
using the statement “Most teachers are interested in students’ well-being”
from ICCS student questionnaire and the bullying scale.
Table 1. Differences in the averages of being bullied between categories
of “Most teachers are interested in students’ well-being”, ICCS 2016.
Strongly disagree Strongly Disagree Agree Strongly agree
Disagree disagree
Agree 0 -2.79 -4.21 -4.36
Strongly agree 2.79 0 -1.42 -1.57
4.21 1.42 -0.15
4.36 1.57 0 0
0.15
The first column contains the reference category, i.e. the one against
which the comparison groups are compared. The values in the rows rep-
resent the differences of the comparison group with the reference group.
The values can be compared by row. In this case, students who disagree
that most teachers are interested in student well-being have 2.79 score
points less on the being bullied scale (-2.79, that is, less frequently bullied)
than those who strongly disagree. Those who agree have 4.21 score points
lower (-4.21) on the bullying scale than those who strongly disagree. Stu-
dents who strongly agree have 4.46 score points lower (-4.36) on the bul-
lying scale than those who strongly disagree. The black rectangles next to
the values pointing up flag higher significant difference of the comparison
group. Black rectangles pointing down flag significantly lower difference
for the comparison group. No rectangle next to the values indicate that
the difference is not statistically significant. For example, students who
strongly agree have 0.15 score points (-0.15) lower score on the bullying
scale compared to those who agree, but the difference is statistically insig-
nificant besides being rather small.
85
2. Continuous variables with a ratio or scale level of measurement.
These variables were obtained from the responses of sets of questions
using IRT (see the previous section for more details).
The analysis of the relationship between the students being bullied
and the categorical variables was done by computing the average of the
bullying scale for each category a respondent (student, student teachers
and school principals) chose. The differences between the means across
categories (each mean with each mean) were then tested for statistical sig-
nificance using multiple dummy coded regression. The report includes re-
sults only for those categorical variables in the data which showed signifi-
cant relationship with being bullied. The table below presents an example
using the statement “Most teachers are interested in students’ well-being”
from ICCS student questionnaire and the bullying scale.
Table 1. Differences in the averages of being bullied between categories
of “Most teachers are interested in students’ well-being”, ICCS 2016.
Strongly disagree Strongly Disagree Agree Strongly agree
Disagree disagree
Agree 0 -2.79 -4.21 -4.36
Strongly agree 2.79 0 -1.42 -1.57
4.21 1.42 -0.15
4.36 1.57 0 0
0.15
The first column contains the reference category, i.e. the one against
which the comparison groups are compared. The values in the rows rep-
resent the differences of the comparison group with the reference group.
The values can be compared by row. In this case, students who disagree
that most teachers are interested in student well-being have 2.79 score
points less on the being bullied scale (-2.79, that is, less frequently bullied)
than those who strongly disagree. Those who agree have 4.21 score points
lower (-4.21) on the bullying scale than those who strongly disagree. Stu-
dents who strongly agree have 4.46 score points lower (-4.36) on the bul-
lying scale than those who strongly disagree. The black rectangles next to
the values pointing up flag higher significant difference of the comparison
group. Black rectangles pointing down flag significantly lower difference
for the comparison group. No rectangle next to the values indicate that
the difference is not statistically significant. For example, students who
strongly agree have 0.15 score points (-0.15) lower score on the bullying
scale compared to those who agree, but the difference is statistically insig-
nificant besides being rather small.
85