Page 204 - Šolsko polje, XXVIII, 2017, no. 5-6: Znanje, motivacija in pogoji učenja v luči mednarodnih primerjav TIMSS in PISA, ur. Barbara Japelj Pavešić in Klaudija Šterman Ivančič
P. 204
šolsko polje, letnik xxviii, številka 5–6
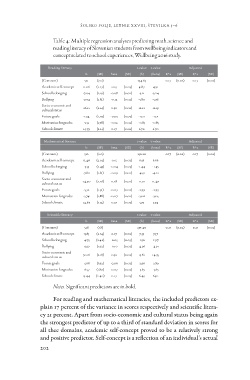
Table 4: Multiple regression analyses predicting math, science and
reading literacy of Slovenian students from wellbeing indicators and
concept related to school experiences, Wellbeing 2016 study.
Reading literacy t-value t-value Adjusted
(Constant) b (SE) beta (SE) (b) (beta) R^2 (SE) R^2 (SE)
Academic self-concept 521 (2.0)
School belonging 11.06 (2.27) 254.63 0.17 (0.02) 0.17 (0.02)
Bullying -7.04 (2.19) 0.13
Socio-economic and -10.52 (1.81) -0.08 (0.03) 4.87 4.91
cultural status -0.12
Future goals (0.02) -3.21 -3.24
Motivation for grades
School climate (0.02) -5.80 -5.76
26.11 (2.14) 0.30 (0.02) 12.21 12.19
-2.34 (2.29) -0.03 (0.03) -1.02 -1.01
-1.51 (1.78) -0.02 (0.02) -0.85 -0.85
14.79 (2.21) 0.17 (0.02) 6.70 6.70
Mathematical literacy t-value t-value Adjusted
(Constant) b (SE) beta (SE) (b) (beta) R^2 (SE) R^2 (SE)
Academic self-concept 522 (2.0)
School belonging 13.46 (2.05) 256.20 0.17 (0.02) 0.17 (0.02)
Bullying -3.53 (2.45) 0.15
Socio-economic and -7.80 (1.81) -0.04 (0.02) 6.56 6.66
cultural status -0.09
Future goals 24.90 (2.26) (0.03) -1.44 -1.45
Motivation for grades 0.28
School climate -5.72 (1.91) (0.02) -4.31 -4.22
-5.74 (1.88) -0.07
14.67 (2.55) -0.07 (0.02) 11.01 11.47
0.17
(0.02) -2.99 -2.93
(0.02) -3.06 -3.05
(0.03) 5.75 5.74
Scientific literacy t-value t-value Adjusted
(Constant) b (SE) beta (SE) (b) (beta) R^2 (SE) R^2 (SE)
Academic self-concept
School belonging 528 (1.8) 291.40 0.21 (0.02) 0.21 (0.02)
Bullying
Socio-economic and 15.85 (2.14) 0.17 (0.02) 7.39 7.57
cultural status
Future goals -4.75 (2.42) -0.05 (0.03) -1.96 -1.97
Motivation for grades
School climate -9.50 (1.92) -0.10 (0.02) -4.96 -4.91
30.16 (2.18) 0.32 (0.02) 13.81 14.35
-5.68 (1.92) -0.06 (0.02) -2.96 -2.89
-6.57 (1.80) -0.07 (0.02) -3.65 -3.65
15.44 (2.40) 0.17 (0.03) 6.43 6.30
Notes. Significant predictors are in bold.
For reading and mathematical literacies, the included predictors ex-
plain 17 percent of the variance in scores respectively and scientific litera-
cy 21 percent. Apart from socio-economic and cultural status being again
the strongest predictor of up to a third of standard deviation in scores for
all thee domains, academic self-concept proved to be a relatively strong
and positive predictor. Self-concept is a reflection of an individual’s actual
202