Page 200 - Šolsko polje, XXVIII, 2017, no. 5-6: Znanje, motivacija in pogoji učenja v luči mednarodnih primerjav TIMSS in PISA, ur. Barbara Japelj Pavešić in Klaudija Šterman Ivančič
P. 200
šolsko polje, letnik xxviii, številka 5–6
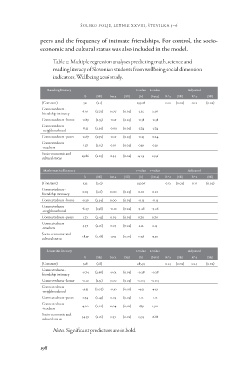
peers and the frequency of intimate friendships. For control, the socio-
economic and cultural status was also included in the model.
Table 2: Multiple regression analyses predicting math, science and
reading literacy of Slovenian students from wellbeing social dimension
indicators, Wellbeing 2016 study.
Reading literacy t-value t-value Adjusted
(Constant) B (SE) beta (SE) (b) (beta) R^2 (SE) R^2 (SE)
Connectedness -
friendship intimacy 521 (2.1) 253.08 0.12 (0.02) 0.12 (0.02)
Connectedness - home
Connectedness 6.10 (2.72) 0.07 (0.03) 2.25 2.26
- neighbourhood
Connectedness - peers -0.89 (2.35) -0.01 (0.03) -0.38 -0.38
Connectedness
- teachers -8.25 (2.20) -0.09 (0.02) -3.74 -3.74
Socio-economic and
cultural status -0.67 (2.72) -0.01 (0.03) -0.25 -0.24
1.27 (2.15) 0.01 (0.02) 0.59 0.59
29.86 (2.05) 0.34 (0.02) 14.54 14.56
Mathematical literacy t-value t-value Adjusted
b (SE) beta (SE) (b) (beta) R^2 (SE) R^2 (SE)
(Constant) 522 (2.0) 255.06 0.12 (0.02) 0.11 (0.02)
Connectedness - 0.03 (2.6) 0.00 (0.03) 0.01 0.01
friendship intimacy
Connectedness - home -0.30 (2.34) 0.00 (0.03) -0.13 -0.13
Connectedness -8.47 (1.98) -0.10 (0.02) -4.28 -4.26
- neighbourhood
Connectedness - peers 1.71 (2.45) 0.02 (0.03) 0.70 0.70
Connectedness 4.57 (2.16) 0.05 (0.02) 2.12 2.14
- teachers
Socio-economic and 28.59 (2.28) 0.33 (0.02) 12.56 13.30
cultural status
Scientific literacy t-value t-value Adjusted
(Constant) b (SE) beta (SE) (b) (beta) R^2 (SE) R^2 (SE)
Connectedness -
friendship intimacy 528 (1.8) 285,95 0.14 (0.02) 0.14 (0.02)
Connectedness - home
Connectedness -0.74 (2.66) -0.01 (0.03) -0.28 -0.28
- neighbourhood
Connectedness - peers -0.10 (2.51) 0.00 (0.03) -0.04 -0.04
Connectedness
- teachers -9.35 (2.07) -0.10 (0.02) -4.51 -4.52
Socio-economic and
cultural status 2.74 (2.45) 0.03 (0.03) 1.12 1.12
4.20 (2.22) 0.04 (0.02) 1.89 1.90
34.39 (2.16) 0.37 (0.02) 15.95 16.86
Notes. Significant predictors are in bold.
198