Page 197 - Šolsko polje, XXVIII, 2017, no. 5-6: Znanje, motivacija in pogoji učenja v luči mednarodnih primerjav TIMSS in PISA, ur. Barbara Japelj Pavešić in Klaudija Šterman Ivančič
P. 197
kozina, m. štraus ■ relationship between academic achievement and wellbeing ...
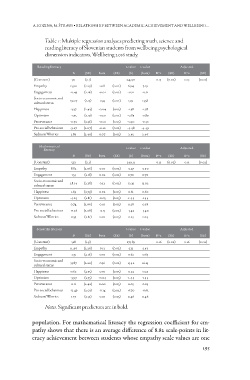
Table 1: Multiple regression analyses predicting math, science and
reading literacy of Slovenian students from wellbeing psychological
dimension indicators, Wellbeing 2016 study.
Reading literacy t-value t-value Adjusted
(Constant) B (SE) beta (SE) (b) (beta) R^2 (SE) R^2 (SE)
Empathy 521 (2.1)
Engagement 15.90 (2.29) 247.50 0.15 (0.02) 0.15 (0.02)
Socio-economic and -0.45 (2.16) 0.18
cultural status -0.01 (0.02) 6.94 7.29
Happiness 29.07 (2.15)
Optimism 0.33 (0.02) -0.21 -0.21
Perseverance -3.37 (2.43)
Pro-social behaviour -1.95 (2.19) -0.04 (0.02) 13.51 13.58
Sadness/Worries -0.70 (2.36) -0.02
-9.27 (2.07) -0.01 (0.03) -1.38 -1.38
5.89 (2.40) -0.10 (0.02) -0.89 -0.89
0.07 (0.03) -0.30 -0.30
(0.02) -4.48 -4.49
(0.03) 2.45 2.46
Mathematical t-value t-value Adjusted
literacy
B (SE) beta (SE) (b) (beta) R^2 (SE) R^2 (SE)
(Constant) 522 (2.1) 249.11 0.13 (0.02) 0.13 (0.02)
Empathy 8.82 (2.06) 0.10 (0.02) 4.27 4.40
Engagement 1.53 (2.18) 0.02 (0.02) 0.70 0.70
Socio-economic and 28.14 (2.28) 0.32 (0.02) 12.35 13.02
cultural status
Happiness 1.69 (2.79) 0.02 (0.03) 0.61 0.60
Optimism -4.05 (2.81) -0.05 (0.03) -1.44 -1.44
Perseverance 0.74 (2.66) 0.01 (0.03) 0.28 0.28
Pro-social behaviour -11.26 (2.08) -0.13 (0.02) -5.42 -5.40
Sadness/Worries 0.59 (2.61) 0.01 (0.03) 0.23 0.23
Scientific literacy t-value t-value Adjusted
(Constant) B (SE) beta (SE) (b) (beta) R^2 (SE) R^2 (SE)
Empathy 528 (1.9)
Engagement 11,.90 (2.26) 275.89 0.16 (0.02) 0.16 (0.02)
Socio-economic and 1.35 (2.16) 0.13
cultural status 0.01 (0.02) 5.25 5.43
Happiness 33.87 (2.20)
Optimism 0.36 (0.02) 0.62 0.63
Perseverance 0.64 (2.75)
Pro-social behaviour -3.97 (2.75) 0.01 (0.02) 15.42 16.25
Sadness/Worries 0.11 (2.42) -0.04
-13.49 (2.01) 0.00 (0.03) 0.23 0.23
1.17 (2.52) -0.14 (0.03) -1.44 -1.44
0.01 (0.03) 0.05 0.05
(0.02) -6.70 -6.65
(0.03) 0.46 0.46
Notes. Significant predictors are in bold.
population. For mathematical literacy the regression coefficient for em-
pathy shows that there is an average difference of 8.82 scale-points in lit-
eracy achievement between students whose empathy scale values are one
195