Page 59 - Štremfel, Urška, ed., 2016. Student (Under)achievement: Perspectives, Approaches, Challenges. Ljubljana: Pedagoški inštitut. Digital Library, Documenta 11.
P. 59
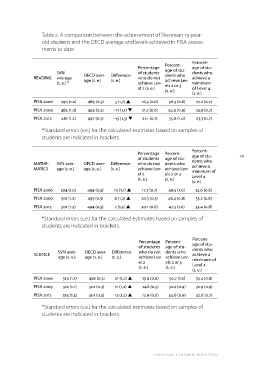
le 2: A comparison between the achievement of Slovenian 15-year-
old students and the OECD average and levels achieved in PISA assess-
ments to date
SVN OECD aver- Difference Percentage Percent- Percent-
READING average age (s. e.) (s. e.) of students age of stu- age of stu-
who do not dents who dents who
(s. e.) * 489 (0.5) 5 (1,1) p achieve Lev- achieve Lev- achieve a
494 (0.5) –11 (1,1) q el 2 (s. e.) els 2 or 3 minimum
497 (0.5) –15 (1,3) q (s. e.) of Level 4
(s. e.)
PISA 2006 494 (1.0) 16.5 (0.6) 56.3 (0.8) 27.2 (0.7)
PISA 2009 483 (1.0)
PISA 2012 481 (1.2) 21.2 (0.6) 54.9 (0.9) 23.9 (0.7)
21.1 (0.7) 55.6 (1.0) 23.3 (0.7)
*Standard errors (s.e.) for the calculated estimates based on samples of
students are indicated in brackets.
Percentage Percent- Percent- 59
of students age of stu- age of stu-
MATHE- SVN aver- OECD aver- Difference who do not dents who dents who
MATICS age (s. e.) age (s. e.) (s. e.) achieve Lev- achieve Lev- achieve a
el 2 els 2 or 3 minimum of
(s. e.) (s. e.) Level 4
(s. e.)
PISA 2006 504 (1.0) 494 (0.5) 10 (1,1) p 17.7 (0.7) 49.5 (1.0) 32.6 (0.6)
PISA 2009 501 (1.2) 495 (0.5) 6 (1,2) p
PISA 2012 501 (1.2) 494 (0.5) 7 (1,2) p 20.3 (0.5) 46.4 (0.8) 33.2 (0.8)
20.1 (0.6) 47.5 (1.0) 32.4 (0.8)
*Standard errors (s.e.) for the calculated estimates based on samples of
students are indicated in brackets.
SCIENCE SVN aver- OECD aver- Difference Percentage Percent- Percent-
age (s. e.) age (s. e.) (s. e.) of students age of stu- age of stu-
who do not dents who dents who
achieve Lev- achieve Lev- achieve a
el 2 els 2 or 3 minimum of
(s. e.) (s. e.) Level 4
(s. e.)
PISA 2006 519 (1.1) 498 (0.5) 21 (1,2) p 13.9 (0.6) 50.7 (1.0) 35.4 (0.8)
PISA 2009 512 (1.1) 501 (0.5) 11 (1,2) p
PISA 2012 514 (1.3) 501 (0.5) 13 (1,2) p 14.8 (0,5) 52.4 (0.9) 32.9 (0.9)
12.9 (0,6) 54.6 (0.9) 32.6 (0.7)
*Standard errors (s.e.) for the calculated estimates based on samples of
students are indicated in brackets.
low reading achievement in pisa 2009