Page 126 - Šolsko polje, XXIX, 2018, no. 5-6: Radicalization, Violent Extremism and Conflicting Diversity, eds. Mitja Sardoč and Tomaž Deželan
P. 126
šolsko polje, letnik xxix, številka 5–6COUNTRYYEARSCALE from 0 to 10:AV ER AGE
(all in %) of 0 = very unsatisfied … 10 = very satisfied VALUE
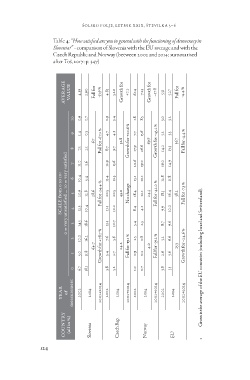
Table 4: “How satisfied are you in general with the functioning of democracy in
Slovenia?” - comparison of Slovenia with the EU average and with themeasurement 4.39
Czech Republic and Norway (between 2002 and 2014; summarised2002 2.90
after Toš, 2017: p. 347) Fall for
-33.9 %
124 4.85
0 1 2 3 4 5 6 7 8 9 10 5.20
Growth for
6.7 5.0 10.0 14.5 12.3 20.9 10.4 11.0 7.1 1.4 0.9 +7.2
6.14
Slovenia 2014 18.1 11.8 16.2 18.6 10.4 12.8 5.4 3.6 2.1 0.3 0.7 7.23
Growth for
64.7 28.6 6.7 +17.8
5.51
2002→2014 Growth for +78.7 % Fall for -34.4 % Fall for -67.2 % 5.27
2002 Fall for
3.8 5.4 7.6 13.1 11.1 20.5 11.4 12.9 8.7 4.7 0.9 -4.4 %
Czech Rep. 2014 5.2 2.7 5.6 10.7 10.2 20.5 12.3 15.6 9.7 4.1 3.4
24.2 43.0 32.8
2002→2014 Fall for -19.1 % No change Growth for +20.6 %
2002
1.0 0.9 2.5 5.4 8.4 18.4 15.1 20.6 17.9 7.7 1.8
Norway 2014 0.7 0.2 0.8 2.3 4.1 10.1 10.1 19.0 26.6 15.6 8.5
4.0 24.3 69.7
2002→2014 Fall for -59.2 % Fall for -42.0 % Growth for +45.2 %
2002
3.8 2.6 5.2 8.7 9.9 18.5 12.8 16.0 14.2 5.2 3.0
EU1 2014 5.5 3.6 6.6 9.6 10.0 16.4 11.8 14.9 13.3 5.3 3.2
25.3 38.2 36.7
2002→2014 Growth for +24.6 % Fall for -7.3 % Fall for -4.4 %
1 Given is the average of the EU countries (including Israel and Switzerland).
(all in %) of 0 = very unsatisfied … 10 = very satisfied VALUE
Table 4: “How satisfied are you in general with the functioning of democracy in
Slovenia?” - comparison of Slovenia with the EU average and with themeasurement 4.39
Czech Republic and Norway (between 2002 and 2014; summarised2002 2.90
after Toš, 2017: p. 347) Fall for
-33.9 %
124 4.85
0 1 2 3 4 5 6 7 8 9 10 5.20
Growth for
6.7 5.0 10.0 14.5 12.3 20.9 10.4 11.0 7.1 1.4 0.9 +7.2
6.14
Slovenia 2014 18.1 11.8 16.2 18.6 10.4 12.8 5.4 3.6 2.1 0.3 0.7 7.23
Growth for
64.7 28.6 6.7 +17.8
5.51
2002→2014 Growth for +78.7 % Fall for -34.4 % Fall for -67.2 % 5.27
2002 Fall for
3.8 5.4 7.6 13.1 11.1 20.5 11.4 12.9 8.7 4.7 0.9 -4.4 %
Czech Rep. 2014 5.2 2.7 5.6 10.7 10.2 20.5 12.3 15.6 9.7 4.1 3.4
24.2 43.0 32.8
2002→2014 Fall for -19.1 % No change Growth for +20.6 %
2002
1.0 0.9 2.5 5.4 8.4 18.4 15.1 20.6 17.9 7.7 1.8
Norway 2014 0.7 0.2 0.8 2.3 4.1 10.1 10.1 19.0 26.6 15.6 8.5
4.0 24.3 69.7
2002→2014 Fall for -59.2 % Fall for -42.0 % Growth for +45.2 %
2002
3.8 2.6 5.2 8.7 9.9 18.5 12.8 16.0 14.2 5.2 3.0
EU1 2014 5.5 3.6 6.6 9.6 10.0 16.4 11.8 14.9 13.3 5.3 3.2
25.3 38.2 36.7
2002→2014 Growth for +24.6 % Fall for -7.3 % Fall for -4.4 %
1 Given is the average of the EU countries (including Israel and Switzerland).