Page 67 - Štremfel, Urška, ed., 2016. Student (Under)achievement: Perspectives, Approaches, Challenges. Ljubljana: Pedagoški inštitut. Digital Library, Documenta 11.
P. 67
The next step in analysing associations between factors (indices) and 67
achievement is an overview of index values by groups of low, basic and high-
er achievement. This gives a rough picture of the differences between the
three groups for each individual gender. The results are presented in Figure
3. As previously stated, the analysis included index values standardised to the
population of female and male students of Year 1 of upper secondary school,
which means the total average in the entire population equals 0 for each in-
dex. Indices can thus be compared in terms of values by individual achieve-
ment groups.
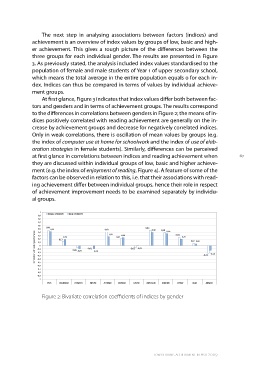
At first glance, Figure 3 indicates that index values differ both between fac-
tors and genders and in terms of achievement groups. The results correspond
to the differences in correlations between genders in Figure 2; the means of in-
dices positively correlated with reading achievement are generally on the in-
crease by achievement groups and decrease for negatively correlated indices.
Only in weak correlations, there is oscillation of mean values by groups (e.g.
the index of computer use at home for schoolwork and the index of use of elab-
oration strategies in female students). Similarly, differences can be perceived
at first glance in correlations between indices and reading achievement when
they are discussed within individual groups of low, basic and higher achieve-
ment (e.g. the index of enjoyment of reading, Figure 4). A feature of some of the
factors can be observed in relation to this, i.e. that their associations with read-
ing achievement differ between individual groups, hence their role in respect
of achievement improvement needs to be examined separately by individu-
al groups.
1 FEMALE STUDENTS MALE STUDENTS
0,9
0,8
0,7
0,6 0,45 0,46
0,42 0,40
0,5 0,41 0,39 0,36
0,27
Correlation with reading performance 0,4
0,3 0,19 0,21 0,24 0,24
0,2 0,13 0,20
0,1
0,07 0,06
0
ESCS ONLNREAD HOMSCH ENTUSE JOYREAD DIVREAD LIBUSE METASUM UNDREM CSTRAT ELAB MEMOR
Figure 2: Bivariate correlation coefficients of indices by gender
low reading achievement in pisa 2009
achievement is an overview of index values by groups of low, basic and high-
er achievement. This gives a rough picture of the differences between the
three groups for each individual gender. The results are presented in Figure
3. As previously stated, the analysis included index values standardised to the
population of female and male students of Year 1 of upper secondary school,
which means the total average in the entire population equals 0 for each in-
dex. Indices can thus be compared in terms of values by individual achieve-
ment groups.
At first glance, Figure 3 indicates that index values differ both between fac-
tors and genders and in terms of achievement groups. The results correspond
to the differences in correlations between genders in Figure 2; the means of in-
dices positively correlated with reading achievement are generally on the in-
crease by achievement groups and decrease for negatively correlated indices.
Only in weak correlations, there is oscillation of mean values by groups (e.g.
the index of computer use at home for schoolwork and the index of use of elab-
oration strategies in female students). Similarly, differences can be perceived
at first glance in correlations between indices and reading achievement when
they are discussed within individual groups of low, basic and higher achieve-
ment (e.g. the index of enjoyment of reading, Figure 4). A feature of some of the
factors can be observed in relation to this, i.e. that their associations with read-
ing achievement differ between individual groups, hence their role in respect
of achievement improvement needs to be examined separately by individu-
al groups.
1 FEMALE STUDENTS MALE STUDENTS
0,9
0,8
0,7
0,6 0,45 0,46
0,42 0,40
0,5 0,41 0,39 0,36
0,27
Correlation with reading performance 0,4
0,3 0,19 0,21 0,24 0,24
0,2 0,13 0,20
0,1
0,07 0,06
0
ESCS ONLNREAD HOMSCH ENTUSE JOYREAD DIVREAD LIBUSE METASUM UNDREM CSTRAT ELAB MEMOR
Figure 2: Bivariate correlation coefficients of indices by gender
low reading achievement in pisa 2009