Page 41 - Štremfel, Urška, ed., 2016. Student (Under)achievement: Perspectives, Approaches, Challenges. Ljubljana: Pedagoški inštitut. Digital Library, Documenta 11.
P. 41
ntify best practice examples in EU member states in relation to the pursuit
of achieving their common goals, and compare the activities with these coun-
tries (European Commission, 2011).
The most interesting point, in view of the significance that EU 2020 and I
& U 2020 attribute to education in relation to achieving smart, inclusive and
sustainable EU growth, is in what fields member states reached a consensus
about making systematic comparisons of their outcomes, and which of these
fields they have highlighted, in terms of benchmarks, as having special strate-
gic importance.8 Within the framework of I & U 2010, five benchmarks9 and six-
teen indicators10 were agreed upon, and within the framework of I & U 2020 the
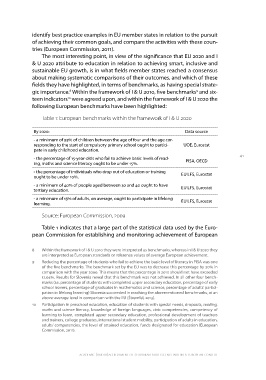
following European benchmarks have been highlighted:
Table 1: European benchmarks within the framework of I & U 2020
By 2020: Data source 41
- a minimum of 95% of children between the age of four and the age cor- UOE, Eurostat
responding to the start of compulsory primary school ought to partici-
pate in early childhood education. PISA, OECD
- the percentage of 15-year-olds who fail to achieve basic levels of read- EU LFS, Eurostat
ing, maths and science literacy ought to be under 15%. EU LFS, Eurostat
- the percentage of individuals who drop out of education or training EU LFS, Eurostat
ought to be under 10%.
- a minimum of 40% of people aged between 30 and 40 ought to have
tertiary education.
- a minimum of 15% of adults, on average, ought to participate in lifelong
learning.
Source: European Commission, 2009
Table 1 indicates that a large part of the statistical data used by the Euro-
pean Commission for establishing and monitoring achievement of European
8 Within the framework of I & U 2010 they were interpreted as benchmarks, whereas in I & U 2020 they
are interpreted as European standards or reference values of average European achievement.
9 Reducing the percentage of students who fail to achieve the basic level of literacy in PISA was one
of the five benchmarks. The benchmark set by the EU was to decrease this percentage by 20% in
comparison with the year 2000. This means that the percentage in 2010 should not have exceeded
17.04%. Results for Slovenia reveal that this benchmark was not achieved. In all other four bench-
marks (i.e. percentage of students with completed upper secondary education, percentage of early
school leavers, percentage of graduates in mathematics and science, percentage of adults’ partici-
pation in lifelong learning) Slovenia succeeded in reaching the aforementioned benchmarks, at an
above-average level in comparison with the EU (Štremfel, 2013).
10 Participation in preschool education, education of students with special needs, dropouts, reading,
maths and science literacy, knowledge of foreign languages, civic competencies, competency of
learning to learn, completed upper secondary education, professional development of teachers
and trainers, college graduates, international student mobility, participation of adults in education,
adults’ competencies, the level of attained education, funds designated for education (European
Commission, 2011).
academic (under)achievement of slovenian adolescents within a european context
of achieving their common goals, and compare the activities with these coun-
tries (European Commission, 2011).
The most interesting point, in view of the significance that EU 2020 and I
& U 2020 attribute to education in relation to achieving smart, inclusive and
sustainable EU growth, is in what fields member states reached a consensus
about making systematic comparisons of their outcomes, and which of these
fields they have highlighted, in terms of benchmarks, as having special strate-
gic importance.8 Within the framework of I & U 2010, five benchmarks9 and six-
teen indicators10 were agreed upon, and within the framework of I & U 2020 the
following European benchmarks have been highlighted:
Table 1: European benchmarks within the framework of I & U 2020
By 2020: Data source 41
- a minimum of 95% of children between the age of four and the age cor- UOE, Eurostat
responding to the start of compulsory primary school ought to partici-
pate in early childhood education. PISA, OECD
- the percentage of 15-year-olds who fail to achieve basic levels of read- EU LFS, Eurostat
ing, maths and science literacy ought to be under 15%. EU LFS, Eurostat
- the percentage of individuals who drop out of education or training EU LFS, Eurostat
ought to be under 10%.
- a minimum of 40% of people aged between 30 and 40 ought to have
tertiary education.
- a minimum of 15% of adults, on average, ought to participate in lifelong
learning.
Source: European Commission, 2009
Table 1 indicates that a large part of the statistical data used by the Euro-
pean Commission for establishing and monitoring achievement of European
8 Within the framework of I & U 2010 they were interpreted as benchmarks, whereas in I & U 2020 they
are interpreted as European standards or reference values of average European achievement.
9 Reducing the percentage of students who fail to achieve the basic level of literacy in PISA was one
of the five benchmarks. The benchmark set by the EU was to decrease this percentage by 20% in
comparison with the year 2000. This means that the percentage in 2010 should not have exceeded
17.04%. Results for Slovenia reveal that this benchmark was not achieved. In all other four bench-
marks (i.e. percentage of students with completed upper secondary education, percentage of early
school leavers, percentage of graduates in mathematics and science, percentage of adults’ partici-
pation in lifelong learning) Slovenia succeeded in reaching the aforementioned benchmarks, at an
above-average level in comparison with the EU (Štremfel, 2013).
10 Participation in preschool education, education of students with special needs, dropouts, reading,
maths and science literacy, knowledge of foreign languages, civic competencies, competency of
learning to learn, completed upper secondary education, professional development of teachers
and trainers, college graduates, international student mobility, participation of adults in education,
adults’ competencies, the level of attained education, funds designated for education (European
Commission, 2011).
academic (under)achievement of slovenian adolescents within a european context